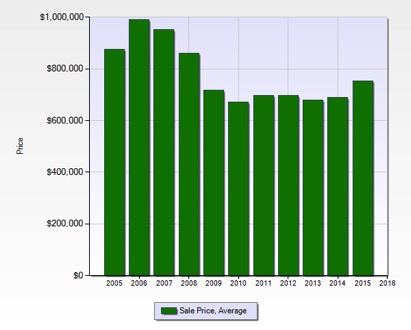
As we wind down the summer, I have many clients asking where the Sandbridge Beach real estate market is compared to the peaks of the market in 2006 & 2007. We have put together the following graph to illustrate where the average sales prices are and have been for the last 10 years. As you can see the last two years have seen modest increases. As always with this unique community, there are many variables to consider when trying to determine the market value for a specific property, please do not hesitate to call or email me for a current market analysis that is specific to your property.